
Nifty 50 in brief: The Nifty 50 isn’t an equal basket of 50 stocks: it’s weighted by market capitalization, which means the top 10 companies alone can drive well over half of the index’s daily movement.
The Nifty 50 isn’t an equal basket of 50 stocks: it’s weighted by market capitalization, which means the top 10 companies alone can drive well over half of the index’s daily movement. Here’s how the index is actually constructed, and what that means for anyone investing through it.
The Nifty 50 is India’s flagship stock market index, representing the 50 largest and most liquid companies listed on the National Stock Exchange (NSE). It is the primary barometer of the Indian equity market. When news reports say “the market rose 2% today,” they are typically referring to the Nifty 50. Understanding how Nifty 50 works is fundamental for every Indian investor, whether you invest in index funds, actively managed funds, or individual stocks.
What is Nifty 50?
Nifty 50 is a free-float market capitalisation weighted index maintained by NSE Indices Limited (formerly India Index Services & Products). It comprises 50 companies across 14 sectors, representing approximately 65% of the total market capitalisation of all stocks listed on the NSE. The index was launched on April 22, 1996, with a base value of 1,000 as of November 3, 1995.
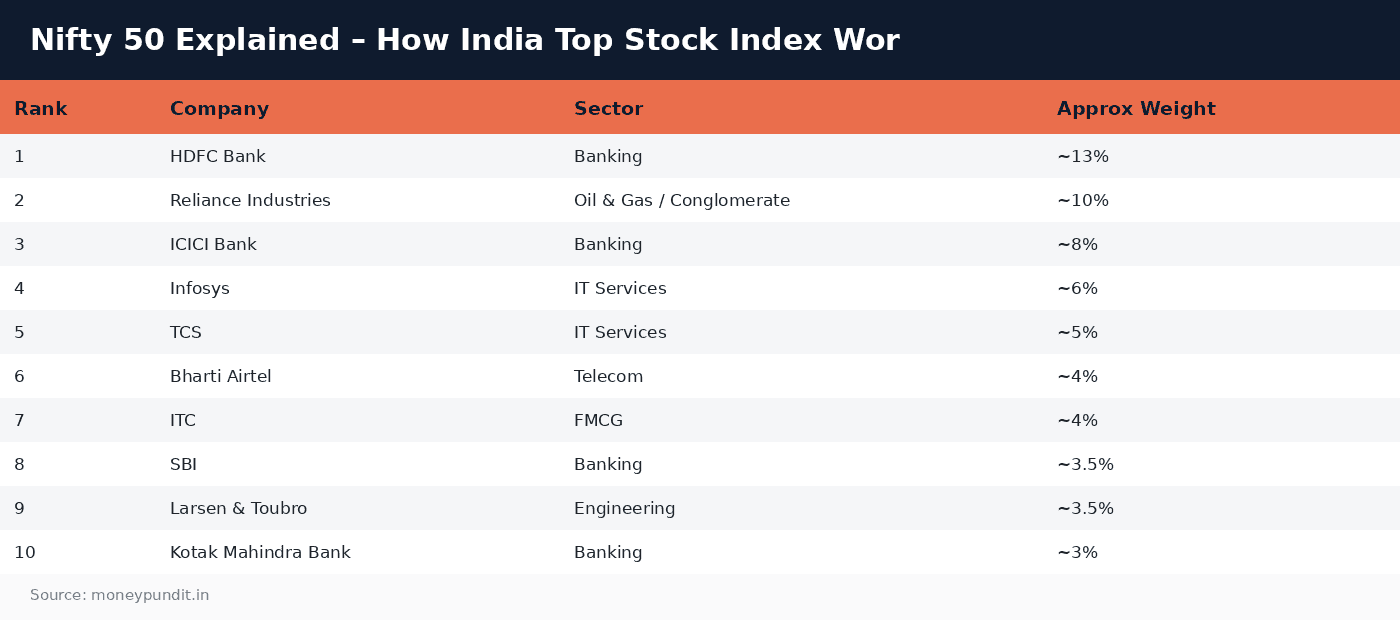
Top 10 Nifty 50 Companies (By Weight)
| Rank | Company | Sector | Approx Weight |
|---|---|---|---|
| 1 | HDFC Bank | Banking | ~13% |
| 2 | Reliance Industries | Oil & Gas / Conglomerate | ~10% |
| 3 | ICICI Bank | Banking | ~8% |
| 4 | Infosys | IT Services | ~6% |
| 5 | TCS | IT Services | ~5% |
| 6 | Bharti Airtel | Telecom | ~4% |
| 7 | ITC | FMCG | ~4% |
| 8 | SBI | Banking | ~3.5% |
| 9 | Larsen & Toubro | Engineering | ~3.5% |
| 10 | Kotak Mahindra Bank | Banking | ~3% |
Weights are approximate and change with market movements. Top 10 stocks account for roughly 60% of the index weight.
How Nifty 50 is Calculated
Nifty 50 uses the free-float market capitalisation method. Free-float means only publicly tradable shares are considered. Promoter holdings, government holdings, and locked-in shares are excluded. The formula: Index Value = (Current Free-Float Market Cap of all 50 stocks / Base Market Cap) × Base Value (1000). The index is calculated in real-time during market hours and updated every second.
Nifty 50 Historical Returns
| Period | CAGR Return | ₹1 Lakh Would Become |
|---|---|---|
| Last 5 years | ~15% | ~₹2.01 lakh |
| Last 10 years | ~12.5% | ~₹3.25 lakh |
| Last 15 years | ~13% | ~₹5.92 lakh |
| Last 20 years | ~14% | ~₹13.7 lakh |
| Since inception (1996) | ~12% | ~₹28 lakh |
Nifty 50 has never delivered negative returns over any rolling 10-year period since inception. This underscores the power of long-term equity investing through a diversified index.
How to Invest in Nifty 50
Nifty 50 Index Funds
The simplest way: buy through any mutual fund platform via SIP or lumpsum. No demat account needed. Top picks include UTI Nifty 50 Index Fund (0.18% expense ratio), HDFC Nifty 50 Index Fund (0.20%), and Navi Nifty 50 Index Fund (0.06%). These funds hold the same 50 stocks in the same proportion as the index. For a broader shortlist beyond these three, our Best Index Funds guide compares expense ratios and tracking error across the top Nifty 50 and Sensex options.
Nifty 50 ETFs
Exchange-Traded Funds trade on the stock exchange like regular shares, requiring a demat account. They typically have lower expense ratios (0.05-0.10%) than index funds but involve brokerage charges and bid-ask spreads. Suitable for lumpsum investors comfortable with stock trading platforms.
Direct Stock Replication
Technically possible but impractical for most investors. Buying all 50 Nifty stocks in their exact weights requires significant capital (₹50 lakh+) and constant rebalancing as weights change. Index funds handle all this for a tiny 0.05-0.20% annual fee.
Nifty 50 vs Sensex
| Feature | Nifty 50 | BSE Sensex |
|---|---|---|
| Number of Stocks | 50 | 30 |
| Exchange | NSE | BSE |
| Sector Diversification | Better (wider coverage) | Good but narrower |
| Base Year | 1995 (base 1000) | 1978-79 (base 100) |
| Used By | F&O trading, most index funds | Traditional benchmark |
| Long-Term Returns | Similar to Sensex | Similar to Nifty |
For investing purposes, Nifty 50 index funds are generally preferred over Sensex funds because of broader diversification (50 vs 30 stocks), lower expense ratios (due to higher competition), and better availability of investment products.
Nifty 50 Sector Composition
Financial Services (banking + insurance) dominate with approximately 35% weight, followed by IT (14%), Oil & Gas (12%), FMCG (8%), Automobiles (5%), and the remaining spread across Telecom, Pharma, Metals, Power, and Construction. This sectoral concentration means Nifty 50 performance is heavily influenced by banking and IT sector trends. For investors wanting broader sector exposure, combining Nifty 50 with Nifty Next 50 or Nifty Midcap 150 provides better diversification.
Frequently Asked Questions
Can Nifty 50 go to zero?
Virtually impossible. For Nifty to go to zero, all 50 of India’s largest companies would have to become worthless simultaneously. An event that has never occurred in any country’s stock market history. Even during the worst crises (2008, 2020 COVID), Nifty fell 50-60% but recovered fully within 1-2 years.
How often do Nifty 50 stocks change?
NSE Indices reviews the Nifty 50 composition semi-annually (January and July). Companies that no longer meet the criteria (market cap, liquidity, free float) are replaced with qualifying candidates. On average, 2-4 stocks are changed per year. This automatic refresh ensures the index always represents the current top 50 companies.
Is Nifty 50 a good investment for beginners?
Nifty 50 index fund is arguably the single best investment for beginners. It provides instant diversification across 50 blue-chip companies, requires no stock-picking skill, has the lowest costs, and has a proven track record of 12%+ CAGR over long periods. Start a Nifty 50 index fund SIP as your first equity investment and add complexity only as your knowledge grows.
What is Nifty PE ratio and how to use it?
Nifty PE (Price-to-Earnings) ratio indicates the market’s valuation level. Historical average PE is around 20-22. When PE is below 18, the market is considered undervalued (good time to invest more). When PE exceeds 25, it is considered overvalued (reduce fresh equity allocation). You can check current Nifty PE on NSE India website or financial portals. However, PE-based timing should only adjust allocation percentages, not stop SIPs entirely.
References: Amfiindia.com
Nifty 50: Key Takeaways
Key points on nifty 50:
- Nifty 50 is a free-float market capitalisation weighted index maintained by NSE Indices Limited (formerly India Index Services & Products).
- Free-float means only publicly tradable shares are considered.
- Nifty 50 has never delivered negative returns over any rolling 10-year period since inception.
Verify the latest nifty 50 figures with AMFI before you act.