

Fundamental analysis stocks in brief: While stock prices fluctuate daily based on market sentiment, a company’s true value is determined by its financials.
Most retail investors pick stocks based on a tip or a chart pattern, while fundamental analysis asks a more basic question: is this actually a good business trading at a fair price? Here’s a beginner’s walkthrough of reading financial statements and valuing a stock properly.
Fundamental analysis is the foundation of successful long-term stock investing. While stock prices fluctuate daily based on market sentiment, a company’s true value is determined by its financials. Revenue, profits, debt, growth rate, and competitive advantages. Learning fundamental analysis helps you identify undervalued stocks worth buying and overvalued ones to avoid. This guide teaches you the essential metrics, ratios, and frameworks used by India’s top investors.
What Is Fundamental Analysis?
Fundamental analysis is a method of evaluating a stock by studying the company’s financial statements, management quality, industry position, and economic factors to determine its intrinsic value. What the stock is actually worth. If the current market price is below the intrinsic value, the stock is considered undervalued (a potential buy). If it’s above, the stock may be overvalued (avoid or sell). Legendary investors like Warren Buffett, Rakesh Jhunjhunwala, and Vijay Kedia have all built their wealth using fundamental analysis.
Step 1: Understand Financial Statements
Profit & Loss Statement (Income Statement)
This shows how much money the company earned and spent over a period (quarterly or annually). Key items to look at include revenue (total sales), operating profit (revenue minus operating expenses), net profit (bottom line after all expenses and taxes), and EPS (Earnings Per Share = net profit divided by total shares). Look for companies with consistently growing revenue and profits over 3-5 years.
Balance Sheet
This is a snapshot of what the company owns (assets) and owes (liabilities) at a specific date. Focus on total assets, total debt, equity (assets minus liabilities), cash and cash equivalents, and reserves. A healthy balance sheet has more assets than liabilities, low debt relative to equity, and sufficient cash to cover short-term obligations.
Cash Flow Statement
This tracks actual cash moving in and out of the business, divided into operating cash flow (from core business operations), investing cash flow (capital expenditure, acquisitions), and financing cash flow (borrowings, dividends, share buybacks). Strong operating cash flow that exceeds net profit is a positive sign. It means the company’s profits are backed by real cash, not just accounting entries.
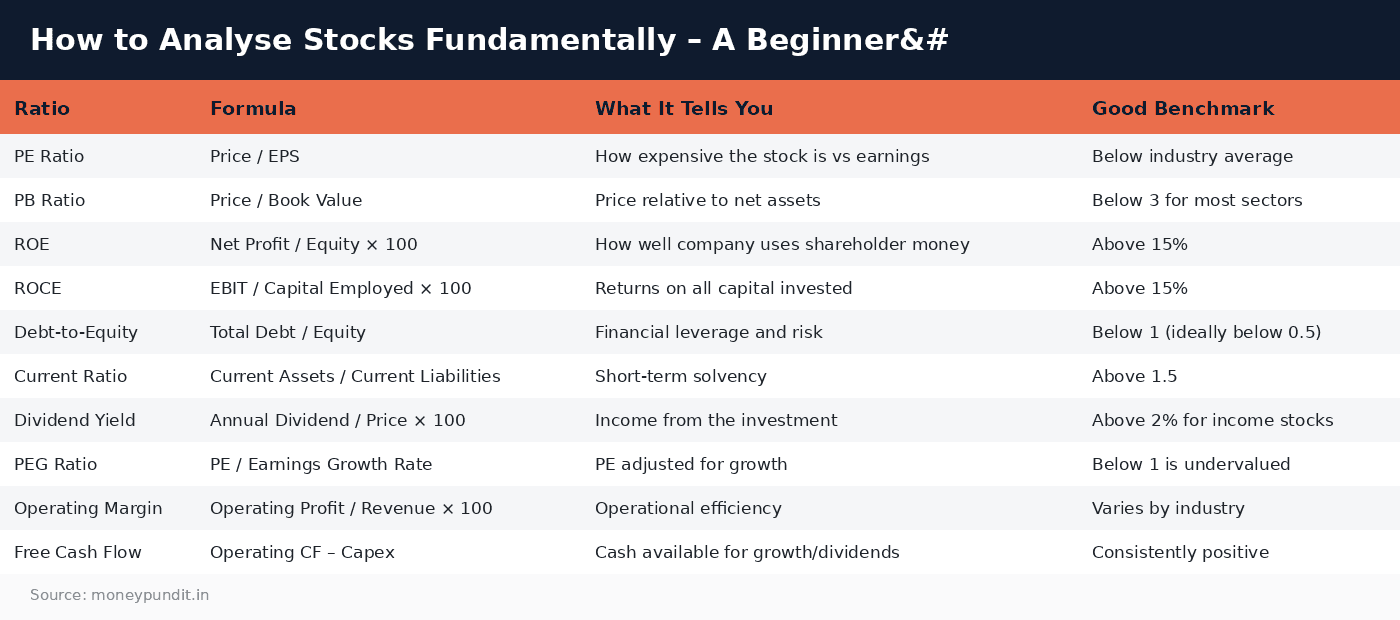
Step 2: Key Financial Ratios
| Ratio | Formula | What It Tells You | Good Benchmark |
|---|---|---|---|
| PE Ratio | Price / EPS | How expensive the stock is vs earnings | Below industry average |
| PB Ratio | Price / Book Value | Price relative to net assets | Below 3 for most sectors |
| ROE | Net Profit / Equity × 100 | How well company uses shareholder money | Above 15% |
| ROCE | EBIT / Capital Employed × 100 | Returns on all capital invested | Above 15% |
| Debt-to-Equity | Total Debt / Equity | Financial leverage and risk | Below 1 (ideally below 0.5) |
| Current Ratio | Current Assets / Current Liabilities | Short-term solvency | Above 1.5 |
| Dividend Yield | Annual Dividend / Price × 100 | Income from the investment | Above 2% for income stocks |
| PEG Ratio | PE / Earnings Growth Rate | PE adjusted for growth | Below 1 is undervalued |
| Operating Margin | Operating Profit / Revenue × 100 | Operational efficiency | Varies by industry |
| Free Cash Flow | Operating CF – Capex | Cash available for growth/dividends | Consistently positive |
Step 3: Qualitative Analysis
Management Quality
Study the promoter’s track record, management’s capital allocation decisions, corporate governance history, and whether management walks the talk on guidance. Check if promoters are increasing or decreasing their stake. Consistent promoter buying is usually a positive signal. Use BSE/NSE filings and annual reports to track this information.
Competitive Advantage (Moat)
Look for companies with a durable competitive advantage: what Warren Buffett calls a “moat.” This could be a strong brand (Asian Paints, Titan), network effects (BSE, CAMS), high switching costs (TCS, Infosys for IT services), cost leadership (D-Mart for retail), or regulatory advantage (ITC for cigarettes, IRCTC for railways). Companies with wide moats tend to maintain high ROE and margins over long periods.
Industry Analysis
Understand the industry’s growth trajectory, competitive dynamics, regulatory environment, and cyclical nature. A mediocre company in a fast-growing industry often outperforms a great company in a declining industry. India’s current high-growth sectors include digital infrastructure, renewable energy, financial services, healthcare, and defence manufacturing.
Step 4: Valuation – Is the Stock Cheap or Expensive?
After analysing the fundamentals, you need to determine if the stock price is attractive. The Discounted Cash Flow (DCF) method estimates the present value of all future cash flows, it’s the most theoretically sound approach but requires making assumptions about future growth rates. The PE comparison method compares the stock’s PE ratio to its historical PE and industry peers, a stock trading below its 5-year average PE may be undervalued. The PEG ratio (PE divided by earnings growth rate) adjusts PE for growth, a PEG below 1 suggests the stock is cheap relative to its growth.
Step 5: Where to Find Financial Data
Several free resources provide comprehensive financial data for Indian stocks. Screener.in is the most popular. It offers 10+ years of financial data, screening tools, and ratio analysis. Tijori Finance provides detailed industry comparison and financial models. Trendlyne offers technical and fundamental screeners with momentum indicators. Moneycontrol and Economic Times have financial data, news, and analyst reports. And the company’s own annual reports (available on BSE/NSE websites) are the most reliable primary source.
A Practical Checklist for Analysing Any Stock
Before investing in any stock, run through this checklist: Is revenue growing consistently at 10%+ annually over 5 years? Is net profit growing at a similar or faster rate? Is ROE consistently above 15%? Is debt-to-equity below 1 (below 0.5 for non-financial companies)? Is operating cash flow positive and growing? Does the company have a competitive advantage or moat? Is the management trustworthy with a clean governance record? Is the PE ratio reasonable compared to historical averages and peers? Is the promoter holding stable or increasing? Are there any red flags in the auditor’s report?
Frequently Asked Questions
How long does it take to learn fundamental analysis?
You can learn the basics in 2-4 weeks of dedicated study. However, developing the judgment to apply these concepts effectively takes years of practice. Start by analysing companies you know (your bank, the FMCG brands you use) and gradually expand to other sectors. Zerodha Varsity’s free modules on fundamental analysis are an excellent starting point.
Is fundamental analysis enough, or do I need technical analysis too?
For long-term investors (holding period 1-5+ years), fundamental analysis alone is sufficient. Technical analysis is more relevant for short-term traders. However, using basic technical indicators like support/resistance levels can help you time your entry better even as a fundamental investor.
Which sectors are hardest to analyse fundamentally?
Banking and financial stocks require specialised knowledge because their balance sheets work differently (loans are assets, deposits are liabilities). Pharma companies need understanding of drug pipelines and regulatory approvals. Real estate companies often have complex land bank valuations. For beginners, start with consumer goods (FMCG), IT services, or manufacturing companies which have more straightforward financials.
Fundamental analysis won’t tell you exactly when to buy or sell, but it will tell you what a business is actually worth. Pair it with a sensible entry price and the patience to hold through short-term noise, and it becomes a genuine edge over guessing.
References: Nseindia.com
Fundamental analysis stocks: Key Takeaways
Key points on fundamental analysis stocks:
- Fundamental analysis is a method of evaluating a stock by studying the company’s financial statements, management quality, industry position, and economic factors to determine its intrinsic value.
- Look for companies with consistently growing revenue and profits over 3-5 years.
- Study the promoter’s track record, management’s capital allocation decisions, corporate governance history, and whether management walks the talk on guidance.
Verify the latest fundamental analysis stocks figures with AMFI before you act.