

Key Personal Finance Statistics for India (2025-26)
A curated collection of the most important personal finance statistics, data points, and benchmarks relevant to Indian investors and households. Updated regularly to reflect the latest available data.
Mutual Fund Industry Statistics
India’s mutual fund industry has experienced remarkable growth. The total Assets Under Management (AUM) crossed Rs 65 lakh crore in 2025, compared to just Rs 10 lakh crore in 2014. The number of unique mutual fund investors (unique PAN) exceeded 5 crore. SIP contributions reached approximately Rs 25,000 crore per month in 2025, up from Rs 8,000 crore per month in 2019. There are over 44 Asset Management Companies (AMCs) operating in India, offering more than 2,500 mutual fund schemes.
Stock Market Statistics
The BSE Sensex has delivered approximately 12-13% CAGR returns over the last 30 years. The number of demat accounts in India crossed 15 crore in 2024, up from 4 crore in 2020. Retail investor participation in Indian stock markets increased significantly post-2020. The NSE is one of the largest stock exchanges globally by number of trades, processing over 1 billion trades per month.
Tax and Income Statistics
Under the new tax regime (FY 2025-26), income up to Rs 12 lakh is effectively tax-free for salaried individuals (with standard deduction). The number of Income Tax Return (ITR) filers in India crossed 8 crore in 2024. Only about 2-3% of India’s population pays income tax. The maximum surcharge rate is 25% on income above Rs 2 crore under the new regime.
Banking and Fixed Deposit Statistics
India has over 50 crore savings bank accounts. The average savings account interest rate is 2.5-3.5% per annum. Fixed deposit rates for major banks range from 6.5% to 8% for general citizens and 7% to 8.5% for senior citizens (as of 2025). Bank deposits remain the largest form of household savings in India, accounting for approximately 35% of total household financial savings.
Insurance Statistics
India’s insurance penetration is approximately 4% of GDP (life: 3.2%, non-life: 1%). The recommended life insurance cover is 10-15 times annual income. Over 70% of Indian households are underinsured. Health insurance coverage has improved with Ayushman Bharat covering over 50 crore beneficiaries, but private health insurance penetration remains below 15%.
Household Savings and Debt Statistics
India’s household savings rate is approximately 20% of GDP. The average household debt-to-income ratio in India is lower than most developed nations at approximately 35-40%. Home loans constitute the largest share of retail credit at approximately 50%. Education loans outstanding crossed Rs 1 lakh crore. Credit card outstanding debt exceeded Rs 2.5 lakh crore in 2024.
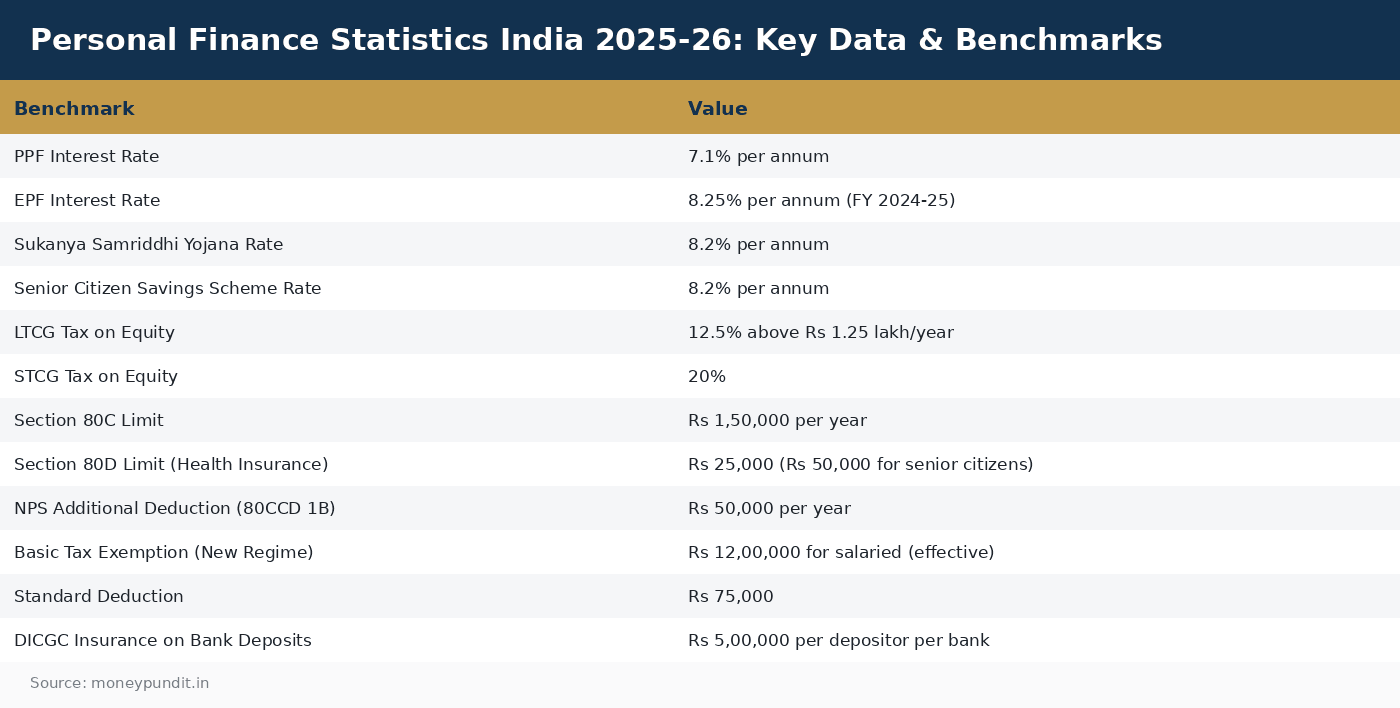
Important Financial Benchmarks (2025-26)
| Benchmark | Value |
|---|---|
| PPF Interest Rate | 7.1% per annum |
| EPF Interest Rate | 8.25% per annum (FY 2024-25) |
| Sukanya Samriddhi Yojana Rate | 8.2% per annum |
| Senior Citizen Savings Scheme Rate | 8.2% per annum |
| LTCG Tax on Equity | 12.5% above Rs 1.25 lakh/year |
| STCG Tax on Equity | 20% |
| Section 80C Limit | Rs 1,50,000 per year |
| Section 80D Limit (Health Insurance) | Rs 25,000 (Rs 50,000 for senior citizens) |
| NPS Additional Deduction (80CCD 1B) | Rs 50,000 per year |
| Basic Tax Exemption (New Regime) | Rs 12,00,000 for salaried (effective) |
| Standard Deduction | Rs 75,000 |
| DICGC Insurance on Bank Deposits | Rs 5,00,000 per depositor per bank |
| RBI Repo Rate | 5.25% (unchanged since April 2026 review) |
| NSC Interest Rate | 7.7% per annum |
Financial Inclusion Milestones
Beyond investment and banking statistics, several national programmes have reshaped how Indians access financial services over the past decade.
- Jan Dhan accounts: 52+ crore opened since the scheme launched in 2014
- UPI transactions: 15+ billion processed per month as of 2026
- Insurance penetration: approximately 4.2% of GDP
- Mutual fund penetration: approximately 18% of GDP, compared to 70%+ in the US
- Financial literacy rate: approximately 27%, improving annually
Explore our full range of financial calculators and personal finance glossary to deepen your understanding of these numbers.
